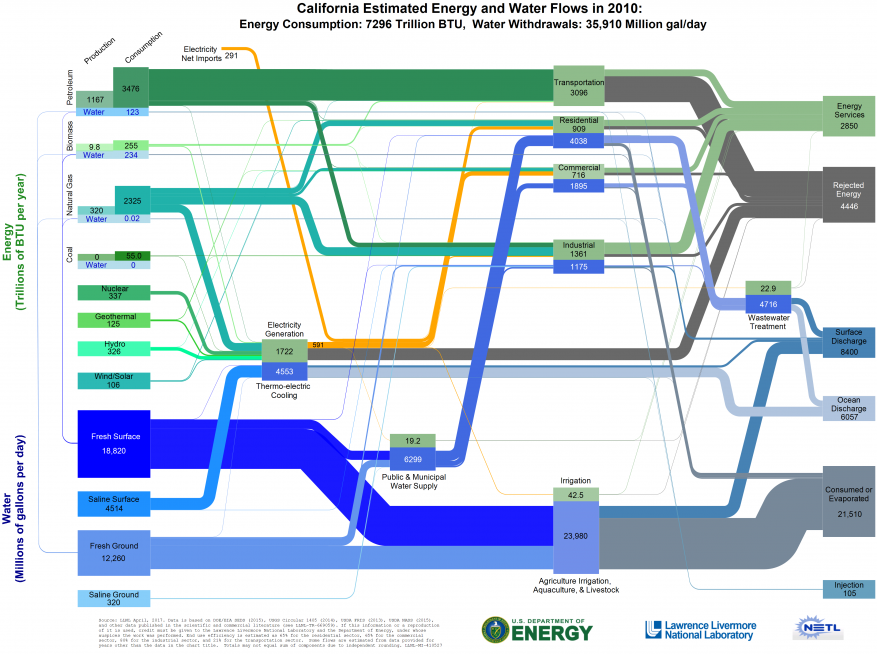
Sankey diagrams can be used to frame important discussions around energy and material resources, use and disposition.
Lawrence Livermore National Laboratory (LLNL) worked with DOE's Office of Energy Policy and Systems Analysis (EPSA) and the National Energy Technology Laboratory (NETL), to produce this atlas of hybrid energy/water Sankey diagrams for each of the U.S. states. These diagrams depict energy use and water flow in each state during the year 2010, the latest year for which comprehensive data is available.
Energy/Water Charts and References
See and download the charts state by state.
Download the full report,"Development of Energy-Water Nexus State-level Hybrid Sankey Diagrams for 2010," LLNL, Sept. 2017. (27.4 MB)
Download the data behind the charts. (Excel doc)

This 2010 California energy use and water flow chart released by Lawrence Livermore National Laboratory (click image for enlarged version).


